Related measures side by side. Enter one set of figures and see how the two results differ, and why.
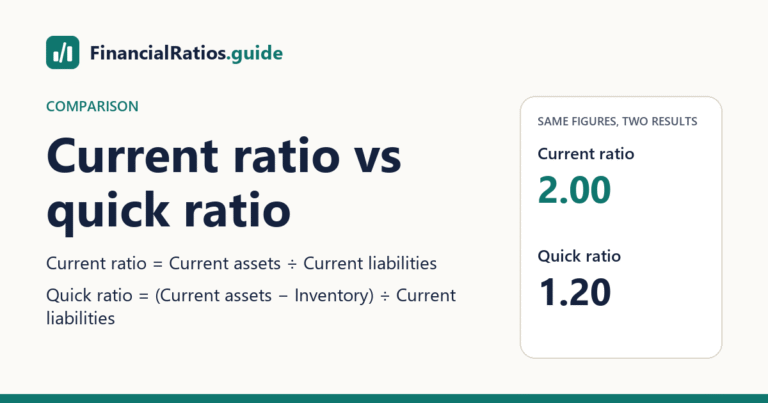
Current ratio vs quick ratioBoth ratios compare short-term assets with current liabilities. The quick ratio leaves out inventory, so it is the stricter test of whether a business can pay its near-term bills without relying on selling stock.
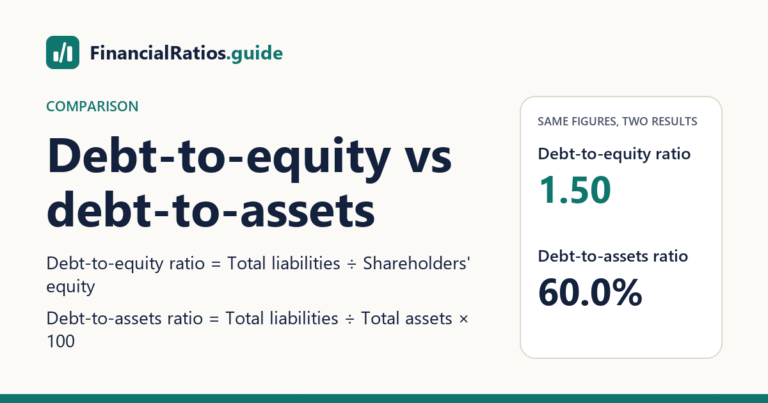
Debt-to-equity vs debt-to-assetsBoth ratios measure how much of a business is financed by liabilities. Debt-to-equity compares liabilities with shareholders' equity; debt-to-assets compares them with total assets, so it shows liabilities as a share of the whole.
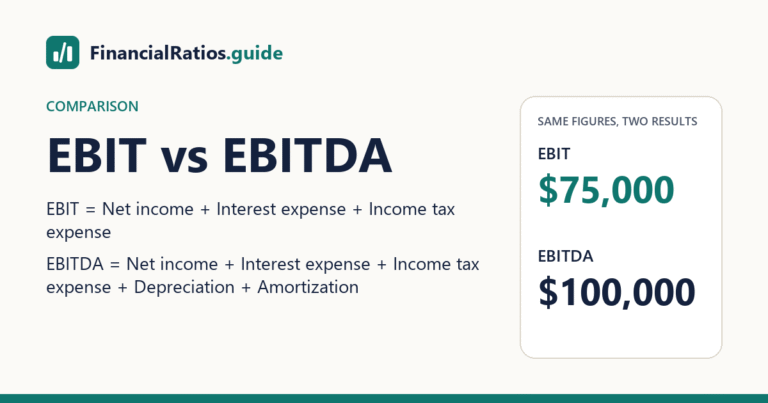
EBIT vs EBITDAEBIT is earnings before interest and taxes. EBITDA also adds back depreciation and amortization, so it is never lower than EBIT and leaves out the cost of using long-lived assets.
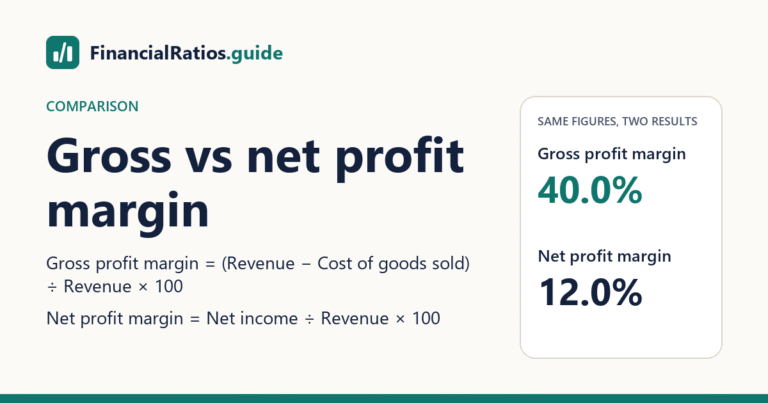
Gross vs net profit marginGross profit margin shows the share of revenue left after the direct cost of what was sold. Net profit margin shows the share left after every expense, including operating costs, interest and tax.
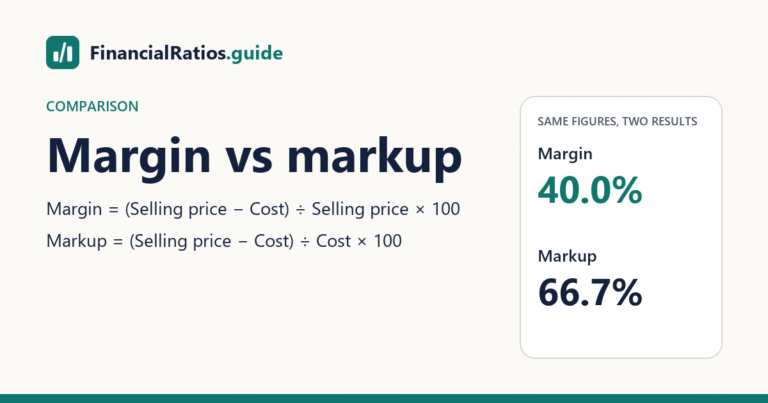
Margin vs markupMargin and markup both start from the profit on a sale: the selling price minus the cost. Margin divides that profit by the selling price; markup divides it by the cost, so a profitable sale always shows a higher markup than margin.
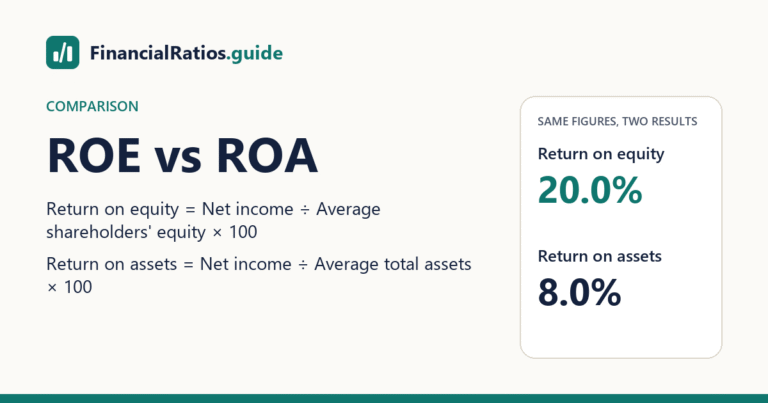
ROE vs ROAReturn on assets divides net income by average total assets; return on equity divides the same profit by average shareholders' equity. The gap between them shows how much the business funds its assets with liabilities rather than equity.